Heart Disease Prediction Using Machine Learning 🫀
Heart disease is still a critical health problem and many lives are lost due to It every year. However, there are some positive implications on the other hand that seem to focus on addressing such problems as the advancements of machine learning discussed above. In this blog there will be explained the way of construction of the system for predicting heart disease based on machine learning approach, which presupposes various stages of systems development, including acquiring, filtering, transforming and exploring data and its modeling.
Understanding Heart Disease and Machine Learning 🤖
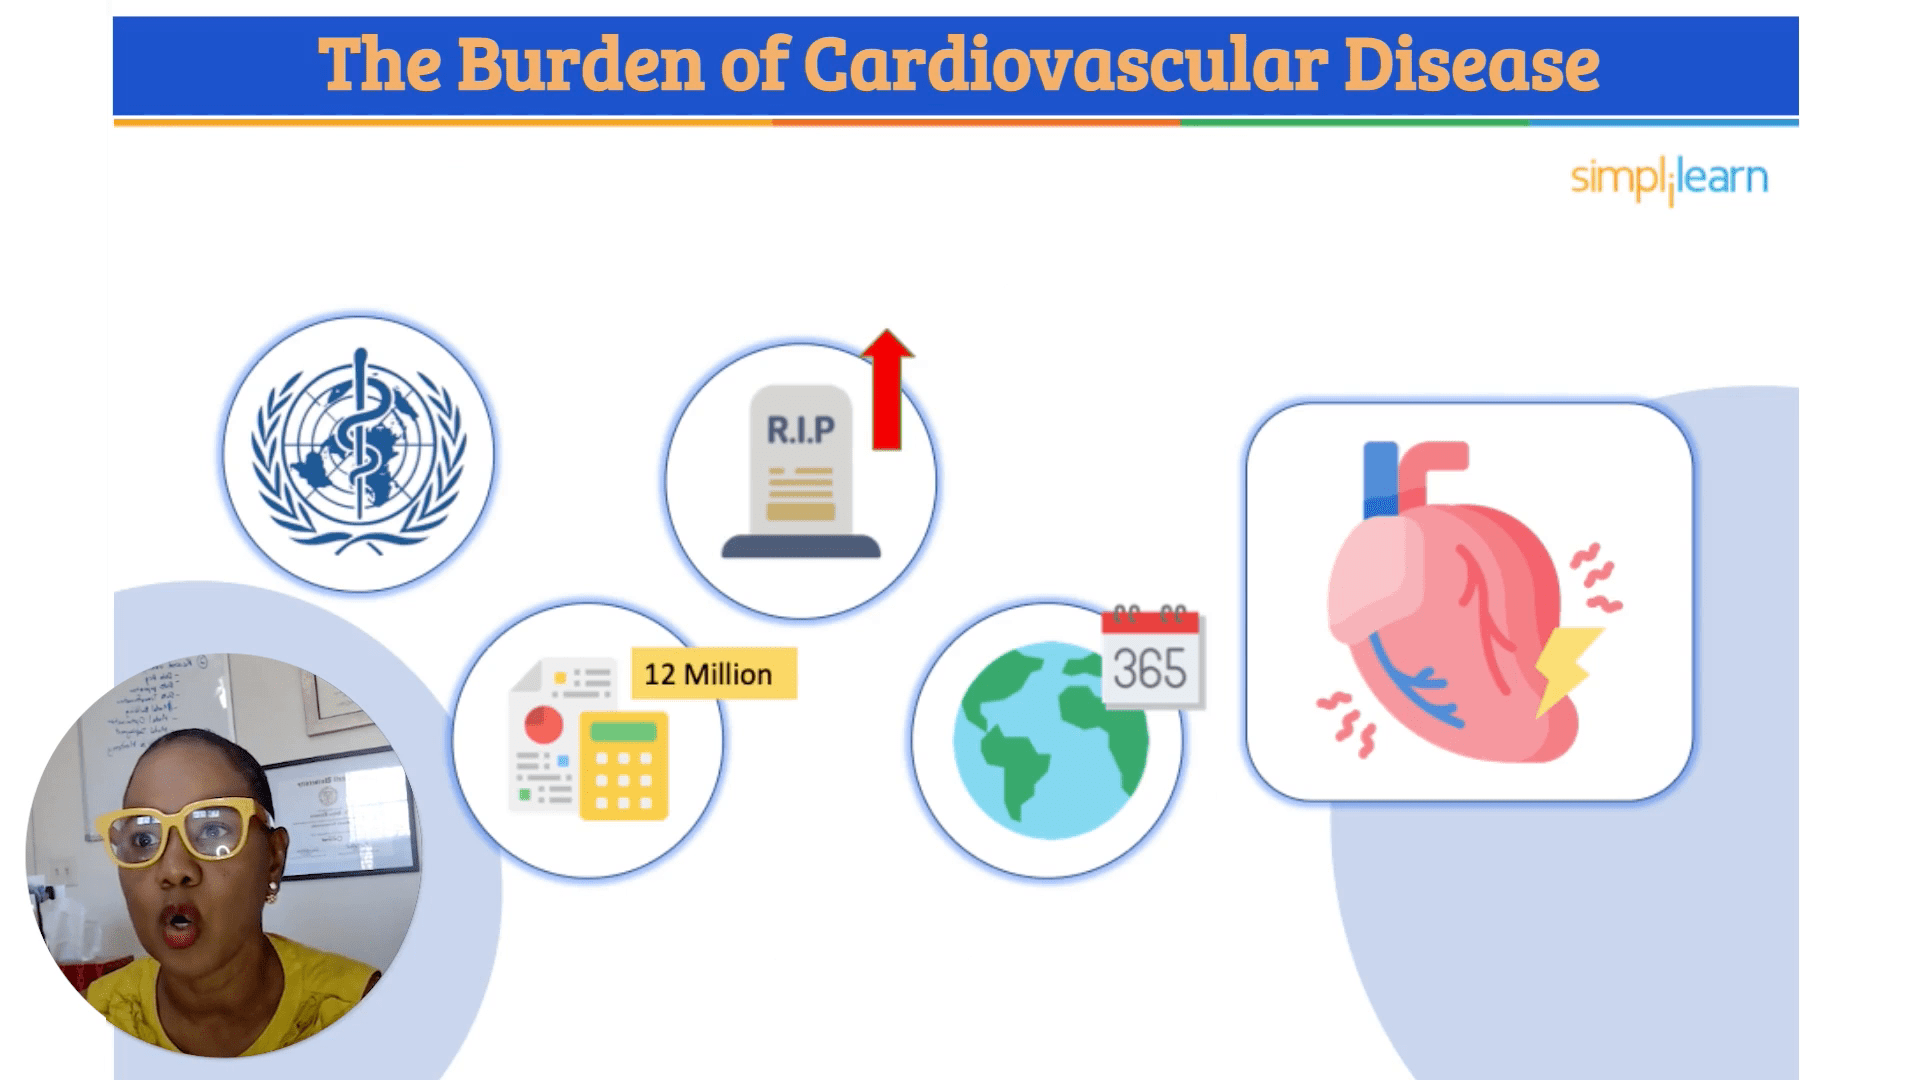
According to WHO, more than 12 million deaths relate to cardiovascular disorders globally every day. This is should not be so since many if not all of these deaths can be avoided by taking measures at early stages. The Framingham Heart Study started in 1948 has also been very important in the collection of data regarding heart disease. Anyone who is asymptomatic can also be diagnosed by applying this extensive dataset and computing algorithms to sort risk factors predicting the disease.

Steps in the Machine Learning Process for Heart Disease Prediction 📊
Summarize the machine learning process for predicting heart disease in five key steps: Acquisition, Filtering, Transformation, Exploration, and Splitting. These steps resemble following a recipe, where each phase is crucial for preparing the data for modeling.
1. Data Acquisition 📥
The first step involves acquiring the necessary data, which can be done through various methods such as web scraping, surveys, or utilizing existing datasets like the Framingham Heart Study. It’s essential that the data is relevant to the problem at hand.

2. Data Filtering 🧹
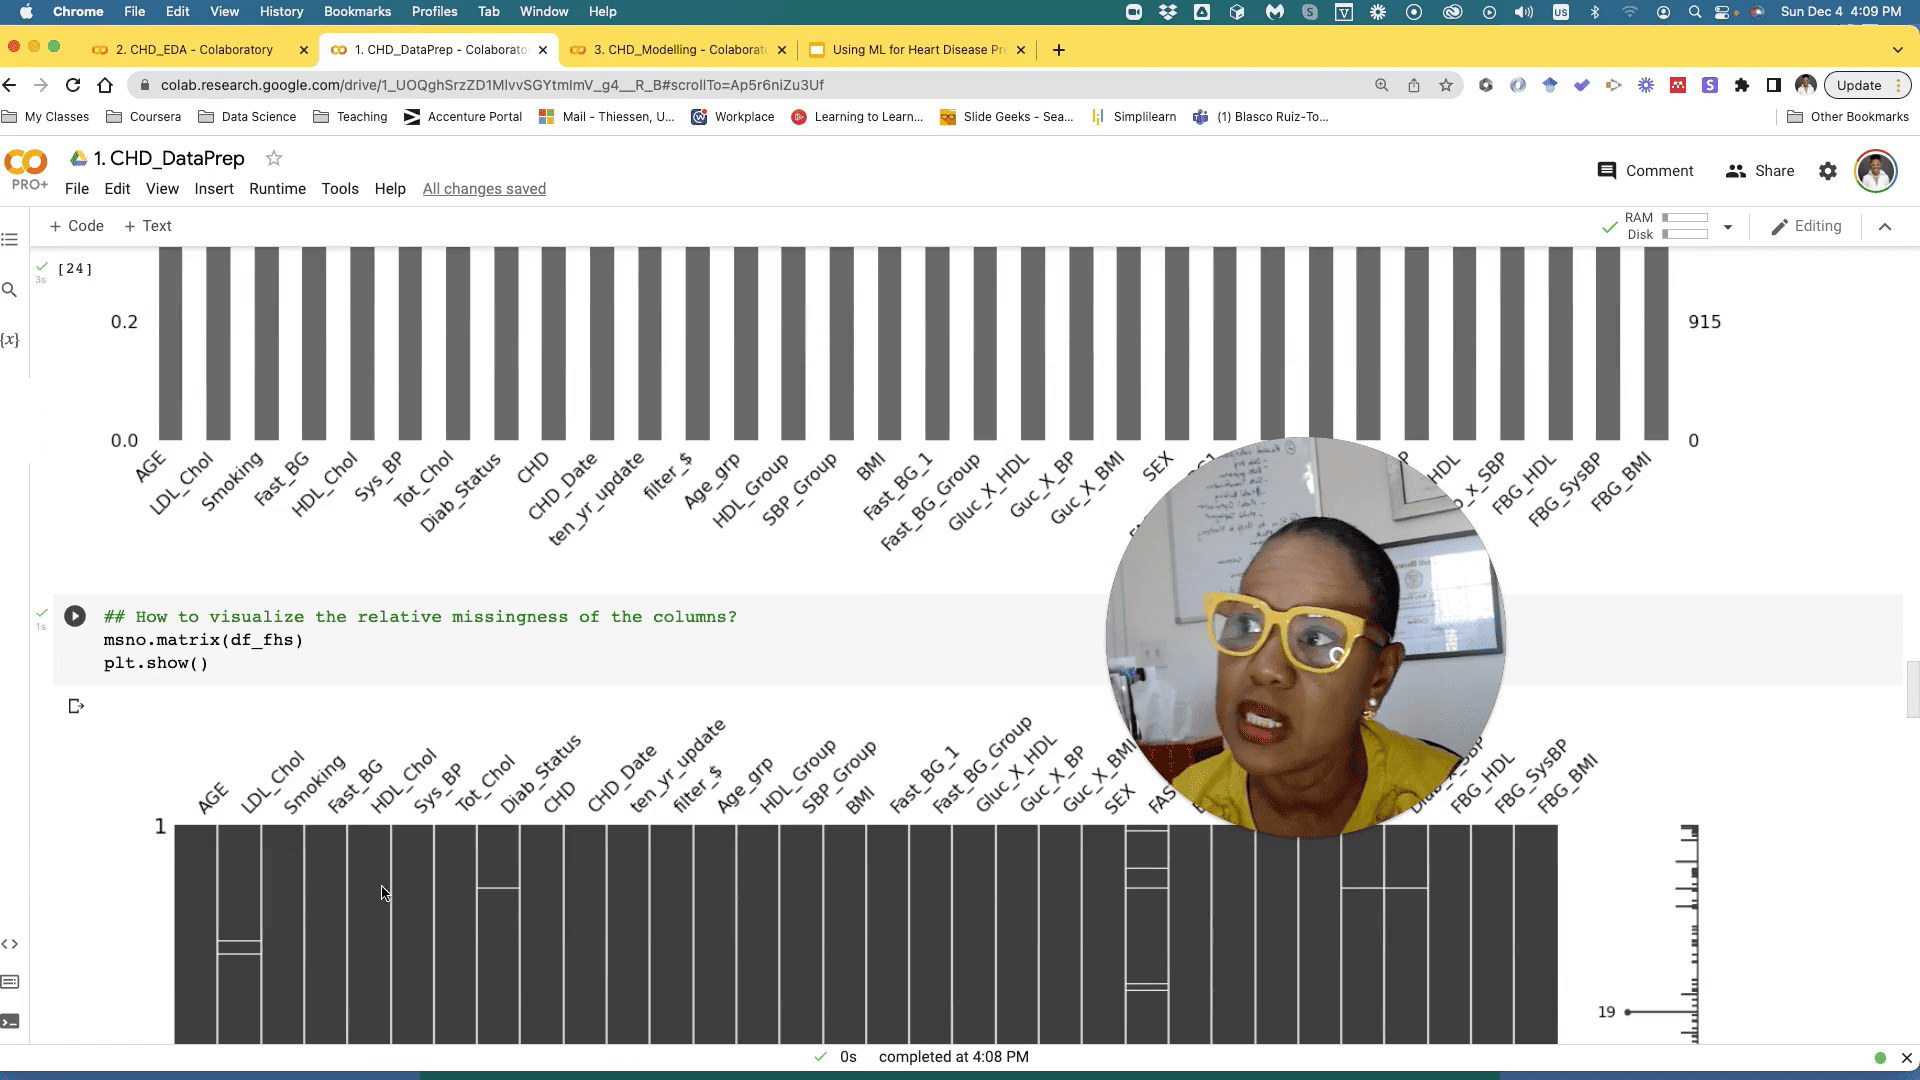
Once the data is acquired, the next stage is filtering. This step involves cleaning the data by removing errors, duplicates, and outliers. It ensures that the dataset is accurate and usable for modeling. For example, if a dataset contains invalid entries, such as text in a numerical column, those entries must be addressed.
3. Data Transformation 🔄
Transformation is crucial because machine learning models require numerical input. This step may involve converting categorical data into numerical formats, normalizing data ranges, and handling date values. Various methods can be employed, including one-hot encoding for categorical features or scaling numerical values to standardize their ranges.

4. Data Exploration 🔍
Exploratory Data Analysis (EDA) is a vital step where we gain insights into the data through visualizations and statistical analysis. This process helps identify trends, correlations, and anomalies within the dataset. For instance, understanding the distribution of variables can guide the selection of appropriate modeling techniques.
5. Data Splitting ✂️
The final preparatory step involves splitting the dataset into training and test sets. This is essential for evaluating the model’s performance on unseen data. A common split ratio is 80/20 or 70/30, where the larger portion is used for training the model, and the smaller portion is reserved for testing.

Building the Model :Heart Disease 🏗️
After preparing the data through acquisition, filtering, transformation, exploration, and splitting, we can proceed to build our machine learning model. The choice of model depends on the nature of the data and the specific problem you are addressing. For heart disease prediction, commonly use logistic regression.
Logistic Regression for Classification 📈
A statistical technique for binary classification issues is called logistic regression. It calculates the likelihood of a binary response by taking into account one or more predictor factors. The model outputs a prediction of whether a patient has heart disease based on the input features.

Evaluating Model Performance 📊
After training the model, it is crucial to evaluate its performance using various metrics such as accuracy, precision, recall, and F1 score. Visualize the model’s performance by employing a confusion matrix, which showcases true positives, true negatives, false positives, and false negatives.
Addressing Class Imbalance ⚖️
In multiple datasets, particularly those used for medical prediction, there can arise the problematic issue of class imbalance. In the case of heart disease prediction, there are more instances of nondiseased cases than are diseased cases. Use methods such as Balancing SMOTE (Synthetic Minority Over-sampling Technique) which tackles such issues where some cases are overrepresented and others are underrepresented.

Conclusion: The Future of Heart Disease Prediction 🔮
Over the years, the use of machine learning has been described as transforming the prediction and treatment of heart diseases. With heart disease risk factors well-known, the health personnel can intervene as soon as possible and realize positive outcomes. With the passage of time, the adoption of the machine learning approaches into the US healthcare system will probably do great enhancing more solutions on old challenges.
For those passionate about machine learning as a career in health care professional angles, there are exposure materials and courses more to know and ameliorate one’s skills in this wonderful field of work.

Look forward to further insights and developments about the machine learning for disease prediction activities within this region!
