Make 3 IMPRESSIVE Excel Charts for Visualizing Data (For Beginners) 📊
Harnessing data visualization skills is indispensable to any data practitioner. It affords us the possibility of seeing things like patterns, trends, and insights which cannot be seen without this element. In this article, we will have a closer look at three of the most impressive types of charts in Excel and how to create them. Beginners or those in need of an update in their skills for practical data representation will benefit from this guide.
Understanding the Importance of Data Visualization 📈
It can be pretty troublesome to extract significant patterns from extensive data. This is where data visualization is very helpful. Representing information in this manner allows us to present intricate details in a straightforward manner. Visual representation of data using bar graphs and charts makes it easier to understand and interpret the information.
Excel has perfectly designed charts which comply with the charts that can be drawn from the data provided. Knowing what type of chart to use when presenting your data will boost your analysis.

Getting Started with Excel Charts 🛠️
In order to insert a chart in the Excel file, you will need first to arrange the data in a sequenced manner. Follow these instructions to get your data ready for the charts’ drawing purposes.
- Break your data into a table with simple column headers.
- Spot the data you wish to graph.
- In Excel, open a new workbook, and create a new worksheet in that workbook, where you will enter your data.
Now that your data is safely stored, you can begin the work of drawing up a chart. We will now consider the first type of chart which can be generated.
Creating a Clustered Column Chart 📊
The clustered column chart is a great way to compare data across different categories. It allows you to visualize the differences between groups clearly.
To create a clustered column chart:
- Highlight your data range including headers.
- Go to the “Insert” tab on the ribbon.
- Click on the “Column Chart” icon and select “Clustered Column.”
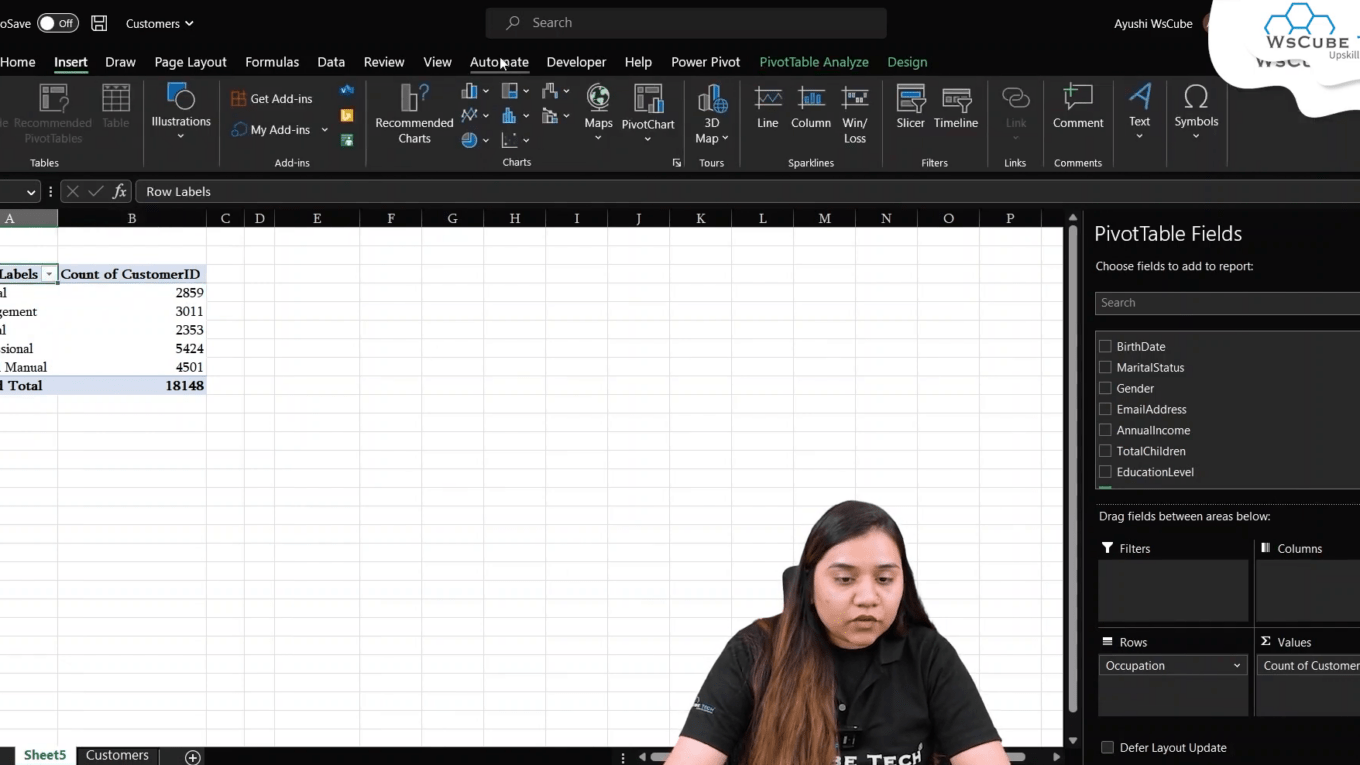
After inserting the chart, you can customize it:
- Add data labels for clarity.
- Change colors to enhance visual appeal.
- Use the “Chart Elements” button to add titles and legends.
Creating a Pie Chart for Part-to-Whole Relationships 🍰
Pie charts are the best way to display how a dataset is composed. They represent proportions of a whole, making it easy to see how different parts contribute to the total.
To create a pie chart:
- Highlight the data you want to visualize.
- Navigate to the “Insert” tab.
- Click on the “Pie Chart” icon and choose the desired pie chart style.
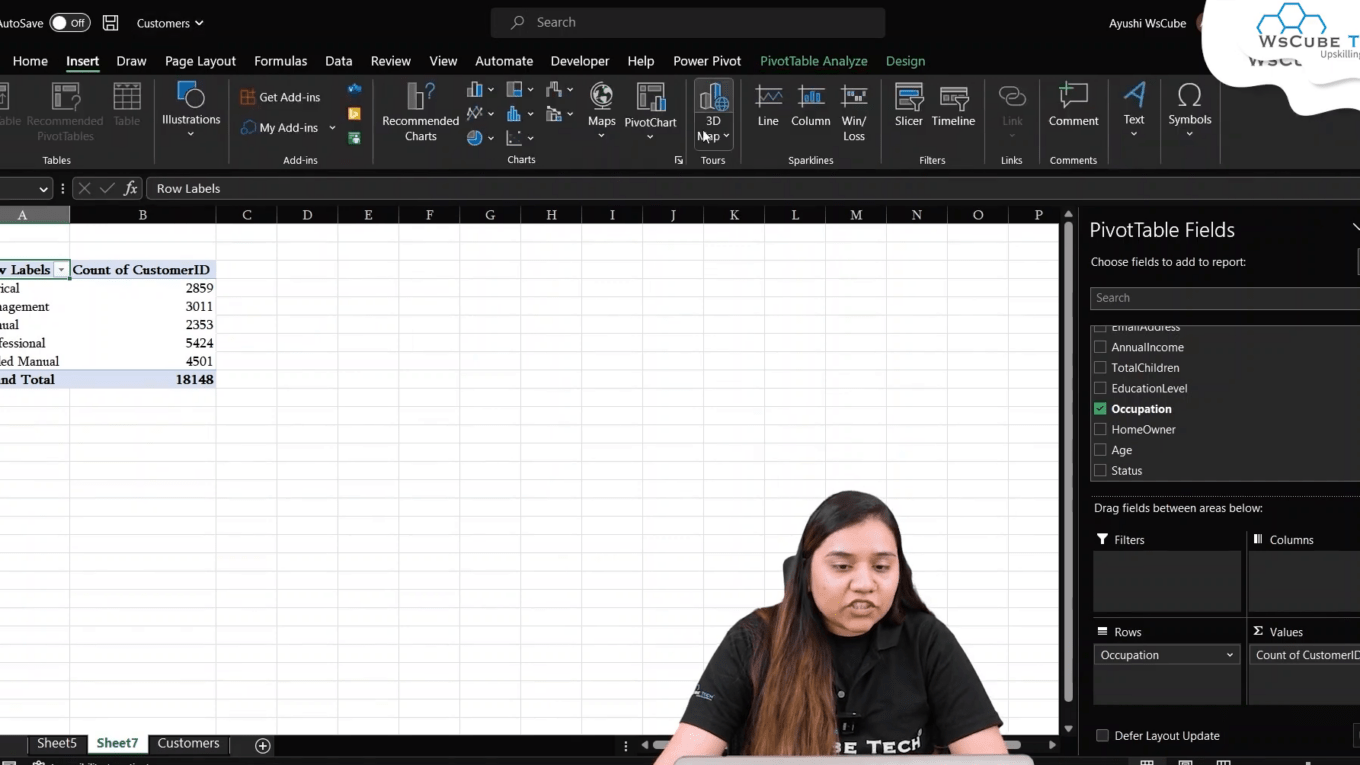
Customizing your pie chart can enhance its effectiveness:
- Change the chart style to match your presentation theme.
- Add data labels to show percentages or values.
- Consider using a 3D pie chart for a more dynamic appearance.
Building a Line Chart for Trend Analysis 📈
Line charts are a great way to show patterns across time. They allow you to see how data points change, making them useful for time series data.
To create a line chart:
- Select your data range.
- Go to the “Insert” tab.
- Click on the “Line Chart” icon and select your preferred style.
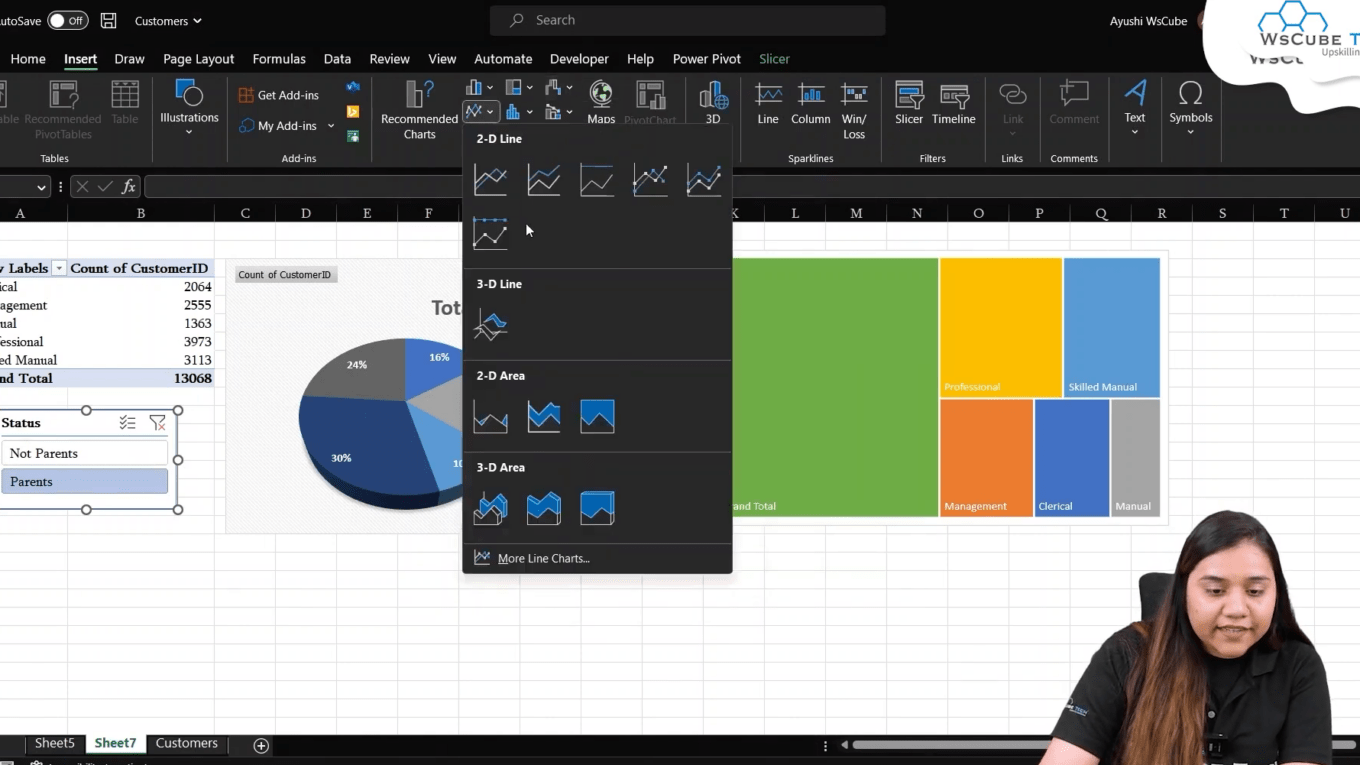
Enhancing your line chart involves:
- Adding markers to data points for better visibility.
- Customizing colors and line styles to differentiate data series.
- Including a trendline to highlight patterns over time.
Advanced Chart Features and Tips: Excel Charts for Visualizing Data 💡
Excel has various advanced features that can help elevate your charts. Here are some tips to enhance your charts:
- Incorporate slicers so that filtering chart elements is more interactive.
- Try out several charts before deciding which one will best represent the information.
- Apply several chart types simultaneously for more complex and ingenious representations e.g. applying both line and column charts.
Also, look at your charts from the perspective of the audience and don’t overload charts with unnecessary information. The purpose of any well-structured chart is to communicate a picture with facts and statistics and does not require thorough study.

Conclusion about Excel Charts for Visualizing Data 🎉
It is essential for every person dealing with data to possess valuable skills such as creating impressive charts in Excel. With the concepts discussed in this article, you will improve your data visualization skills.
It is a common misconception that data visualization only entails the drawing of graphs and making presentations. Presenting data in the correct context to the audience requires an appropriate chart.
Soon enough you will be in a position to draw charts that will not only be visually appealing but will also explain the points that you are trying to get across. Pick up those tools and get creative with your charts!
